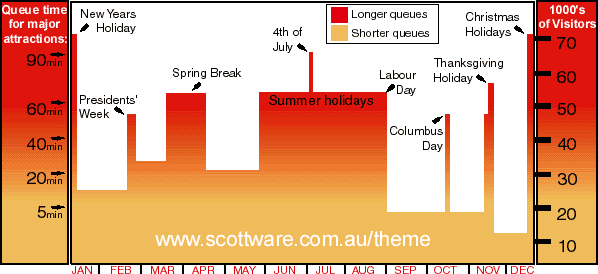
Graph from The Disneyland Linkage, which is not an official Disney site.
I found this graph when I was trying to decide whether or not to take my tot to Disneyland one afternoon. I bought a season pass because I live 40 minutes away and now I feel compelled to go before it expires. Besides, I had to pick up something 5 minutes away so I thought I’d drop in for a few rides and leave. This graph was very helpful and turned out to be quite accurate. This is for major attractions like Splash Mountain and Indiana Jones so you can expect the lesser rides to be about half of what is on the graph, according to my one day analysis of this information =) Initially, this graph was made for Disneyland but it turns out that all Disney parks, and probably all amusement parks in general, follow the same pattern. But only in the US as this is all based around US holidays. I found this to be helpful in planning my summer trips and since the amusement park season is upon us, I’m sure you could use this for reference as well! Happy lines standing =)

